White Mule Press (Distilling.com) will release Pearman’s Distillery Finance book in early 2022 as a financial fundamentals resource for craft spirits producers. This chapter on budgeting is an excerpt.
Budgeting Basics
The budget is your financial roadmap to achieve company goals. When working with new clients one of my first questions is “do you have an annual budget process?” A budget expresses guideposts in dollars so a company can see if they are on track to meet expectations, and serves as a management tool. It is the heart of measuring financial performance.
A strategic and managerial tool
Often, the budgeting process will follow a strategic planning session. While big picture goals are defined in the strategic planning session, the budget process metes out those ideas into defined financial targets. Big goals are crystallized into specific strategies for each department and financial metrics are assigned to each strategy. In addition to clarifying company goals, the budget process is a gut check on whether the goals are achievable.
Each department head is responsible for writing their own budget that aligns with company goals, and thus creates alignment within your team. Knowing that he or she will be held accountable to the budget, department heads generally have much more buy-into company goals than they otherwise would.
A budget can be used to drive accountability. In the monthly review of financials, the department-specific budget versus actual reports are reviewed so that each department head is held accountable for their performance. Compensation structure should be tied to the ability of the individual to manage the budget.
The distillery budget flowchart
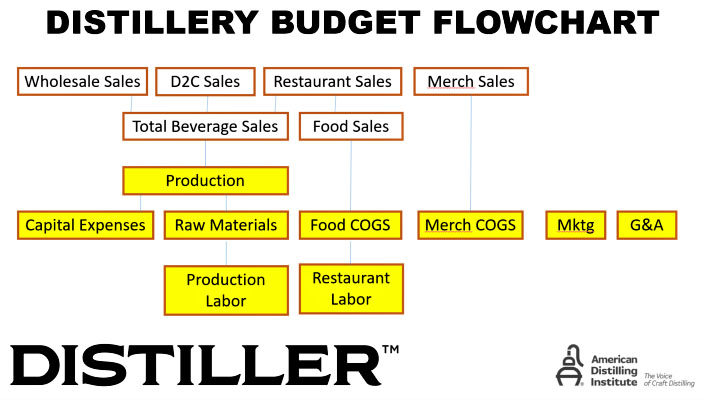
Sales sets the tone and all other budgets flow from the sales projection. Forecast your sales by case equivalents or proof gallons for the future year by distributor, by SKU, by month. (If you have a restaurant or taproom, each location should be treated as if it were a separate distributor.)
In the Distillery Flow Chart (figure 1), the first two rows are revenue centers and the bottom three rows are expense centers. Create a separate budget for each item on the flow chart. These will be consolidated into one master budget by the CFO.

Broadly speaking, there are three steps of the budget process:
- Create departmental budgets
- Consolidate
- Refine
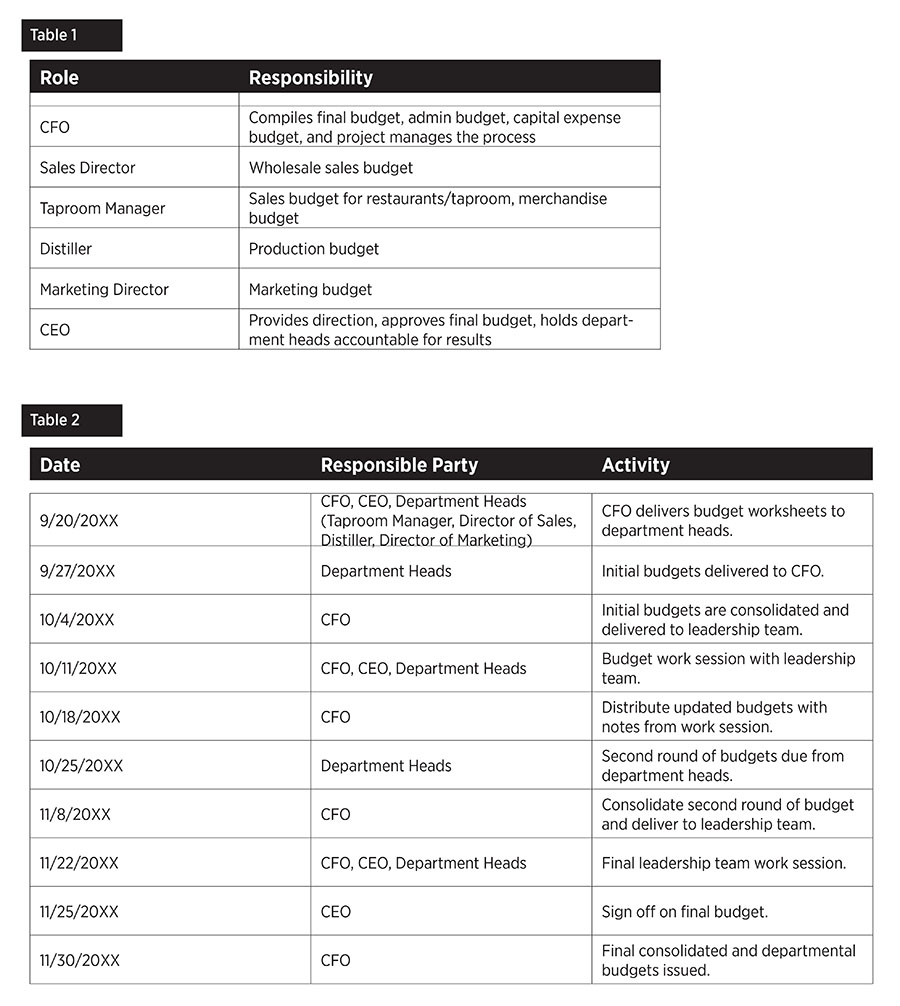
Start with Excel-based templates for your revenue center department heads to complete. This is usually your sales director and taproom manager. Then provide a template to your distiller or head of production to work on the production schedule, raw materials, and labor budgets.
Meanwhile, the tasting room manager and marketing manager work on their cost budgets, the sales director works on the cost budget for that department, and the CFO works on an administrative budget and a capital expenses budget.
All of these budgets are compiled and revised multiple times before you have a final budget. (Table 1)
Budget calendar
Table 2 is a suggested timeline for the budget process. Expect the process to take two to three months.

Budgeting Distillery Raw Materials
In your production planning software export a report for the average COGS per PG per brand of spirit produced in the prior year. Then use this average historical unit cost and multiply by the quantity of brand forecasted to be sold by month. Be sure to account for changes to raw materials costs, changes in packaging materials, choice of vendors, cost increases due to inflation, etc.
Establishing a template for a tasting room
The budget template for a restaurant or tasting room often starts with assigning costs as fixed or variable, and then forming assumptions on how those costs will increase or decrease based on historical data. For example, if the General Manager position is salaried and you expect to give the position a 5% raise, forecast the coming year’s expense as 105% of the same period in the prior year.
Pulling it all together
After departmental budgets are created, the CFO will consolidate them all into one master budget. Every department budgeted P&L will be a separate tab in the same Excel workbook. Create one summary P&L that combines data from the departmental tabs. Once the consolidated P&L is created a Balance Sheet and Statement of Cash Flows can be forecasted.
Seeing all data accumulated into set of forecasted financial reports will reveal areas that need to be adjusted. Do you need to add capex to achieve the sales goals? Are there months where cash is falling too low? Are you still able to meet bank covenants every quarter?
Answering these questions and developing solutions to problem areas will require the leadership team to work together. After a few rounds of revision, the result is an intentional roadmap that leads the company closer to its goals.
From Budget to Forecast
A budget is a plan for a static set of circumstances; current performance is measured against outdated expectations. A forecast is a plan for a flexible scenario. Current performance is measured against the most recent actual results.
A budget is usually made in the fourth quarter of the preceding year. It is static and has no flexibility to adjust for unforeseen changes. Examples of what might change include distributor consolidations, change in consumer preferences, packaging material shortages. When reviewing budget vs actual reports, you are comparing current performance in your current situation to your current performance in an old situation. Measuring your performance to budget is anchoring your expectations to the past. You are looking in the rearview mirror. A rolling forecast, on the other hand, keeps your head up as you scan the horizon; you are moving to the future. Skating to where the puck is going to be, as National Hockey League start Wayne Gretzky might say. In a forecast you update each month as actual results become known and better information is available to forecast expectations for the remainder of the year.
Creating the distillery forecast model
A forecast doesn’t replace the need for a budget. A budget serves as the starting point for your forecast. Updating a forecast on a monthly basis keeps you attuned to the rhythms of your business and predicting what will happen becomes a much less mysterious endeavor. No need to reforecast the entire budget each month; high level forecasts are just as effective. For example, you could forecast only big ticket items like Revenue, COGS, Labor, and Operating Expenses. Choose the level of complexity that serves your business. Forecast models range from very simple to extremely complex. Choose the level of detail that provides the most benefit to you.
The practice of forecasting allows you to stay attuned to the rhythm of your company. You have a sense of how quickly your organization can pivot. You gain a sense of key indicators of the business. Creating a forecast doesn’t mean that you have to do a budget every month. Rather, focus on the larger categories of accounts. If you see that a category is out of reasonable range, then you should dive into the detail to gain clarity.
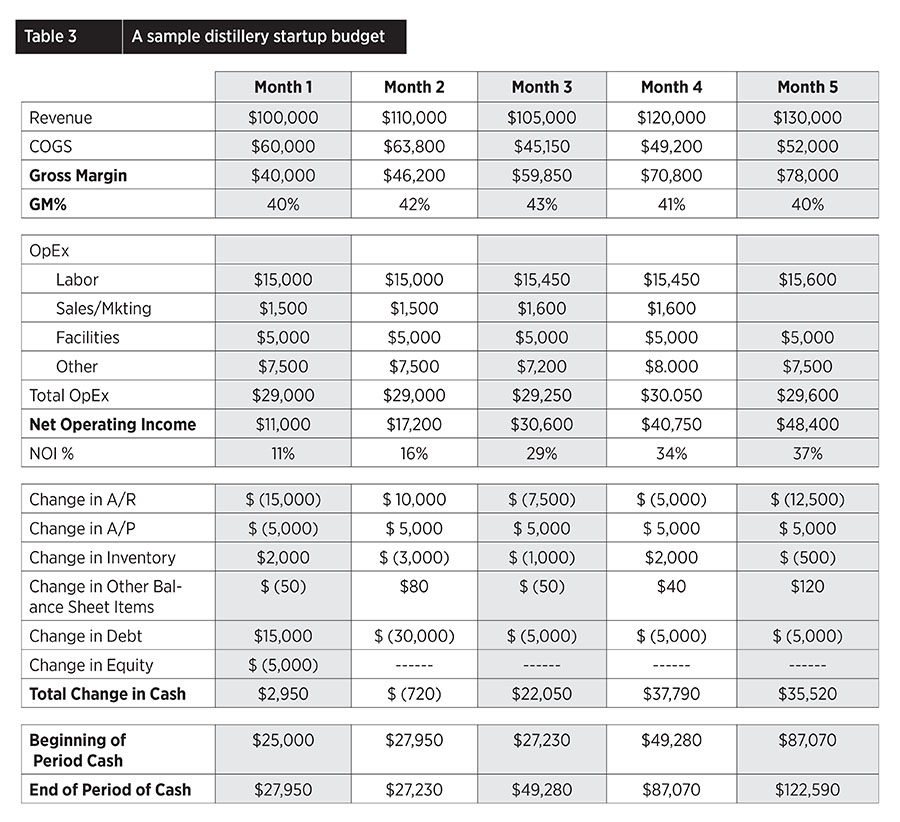
In Table 3, below two months of actual data and three months of forecast is shown. This is a condensed example, and in reality the forecasted portion would go out for 12 months. Note that this model combines the Profit and Loss statement with elements of the Balance Sheet, allowing you to see in one report the effect on cash. This is not a standard financial report, but rather a report created for management purposes.
Of all rows in the chart, end of period cash is most important. Keep your eye on ending cash and be aware of months that are predicted to be low. Net operating income is the second most important number on the model. (Remember, cash is king!)

Rhythm of forecast updates
To generate a forecast first create an annual budget by month in fourth quarter of the year prior to the budget period. At the close of the first month, replace the forecasted Month 1 with the actual Month 1 results. Given the actual results of Month 1, consider what changes should be made to future months through end of year. Keep any changes high-level. Things to consider are revenue, sales mix, COGS %, operating expenses for broad categories (such as labor, sales and marketing, and facilities). Monthly updates help you see what you have done year-to-date and where you expect to end the year. Keeping the forecast at a high level makes it easy and quick to update.
Review your forecast monthly with the leadership team. Ask department heads to provide assumptions for the forecasted periods. The monthly review allows the organization to consider if assumptions are reasonable. For example, if your head of Sales estimates that case sales will double next month, your head of Production may take issue with that estimate. He may understand that the facility doesn’t have the time or capacity to fulfill double the quantity on order. The monthly review with the leadership team helps department heads gain a better understanding of the organization’s finances. It forces them to think proactively about what they know will happen in the coming months and how that will affect revenues and expenses. The forecast allows the financial planning aspect of the organization to be a living, breathing activity, not something that happens once per year.
Use your forecast to answer questions. It can help answer questions like “are we profitable?” or “how close are our sales to our targets?” or “where are we spending money?” or “is our operation self-sustainable?” The sooner your team sees changes happening in the financials, the faster they can respond. Timely response minimizes the risk of a multiple-month decline.
— Maria Pearman is a Certified Public Accountant who provides accounting expertise and a deep operational knowledge to the beverage alcohol industry. She has also taught in craft beverage business programs at the University of Vermont and Portland State University. Maria’s specialties include finance and accounting, business strategy, beverage alcohol-specific production planning and ERP software. She earned her BA from the College of Charleston in her home state of South Carolina. She resides in Bend, OR, and can be reached at mpearman@perkinsaccounting.com.


